- ACH
- county
- age group
- gender
- race/ethnicity
- language
Medicaid Population Explorer
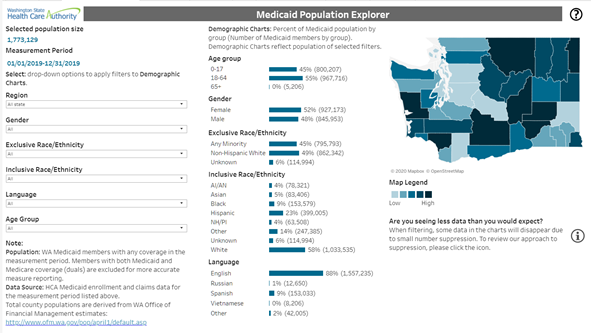
The Medicaid Population Explorer dashboard shows the number of Medicaid members living in the state of Washington. You can filter by:
What kind of questions can this dashboard answer?
- What percent of an ACH region is enrolled in Medicaid?
- How many of those are children?
- How does that compare to other counties?
How do I interact with the Medicaid Population Explorer?
You can explore different groups by selecting demographic information in the dropdown menus to the left. Selecting multiple demographic characteristics will help you focus in on more specific groups. The map on the right highlights the selected region, regardless of the selected demographics. Hovering over acounty on the map displays the ACH it belongs to, the county name, as well as the proportion of Medicaid members within that county. The map legend identifies by color representation teh low to high percentages of Medicaid members within that county.Measure Explorer
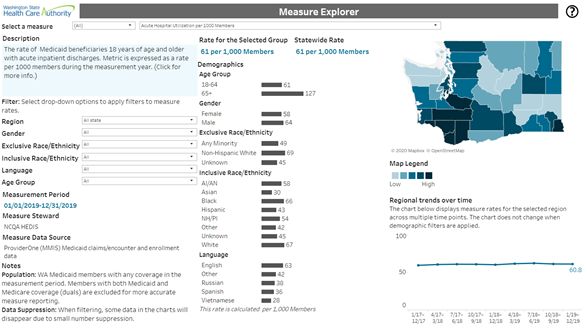
The Measure Explorer dashboard shows measure rates for Medicaid beneficiaries. Select a measure and then filter by:
- ACH
- county
- age group
- gender
- race/ethnicity
- language
What kind of questions can the Measure Explorer answer?
- Which populations have the highest and lowest rates of preventive diabetes care?
- Are there differences in measure rates by county?
How do I interact with the Measure Explorer?
To select a measure, use the dropdown menus at the top of the dashboard. To look at rates for a different set of members, use the dropdown filters on the left to change the targeted group. The rates for the selected group display in the middle column. Unlike the population explorer county chart, the map on the right responds to the filter selections, displaying the measure rates by county, in addition to other details regarding the the selected filters. Hover over a data point in regional trends over time to display additional information.Measure Maps
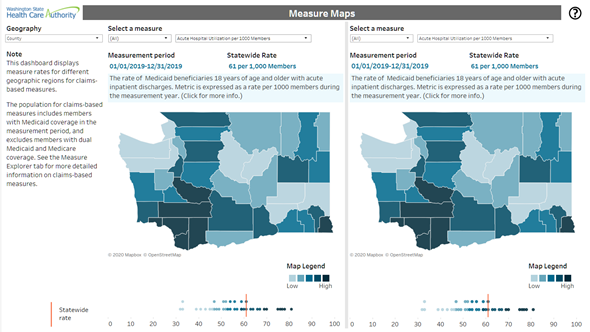
The Measure Maps dashboard allows you to explore and compare measure rates for Medicaid Beneficiaries by different geographic regions (ACH, county, or zip code).
What kind of questions can Measure Maps answer?
Do counties with high rates of child primary care use also have high rates of well-child visits?How do I interact with Measure Maps?
The Measure Maps dashboard provides a drop-down menu to select the geographic level of the maps, and two different drop-down menus for selecting measures to compare. Selecting a new geographic level will change both maps in the dashboard. Geographic areas are bucketed into quintiles based on their measure rates. Quintiles divide geographic regions into five ranked, equal-sized groups. Below the maps are stacked dot plots, called jitter plots, which show the values for geographic areas (dots) in relation to the statewide rate (vertical line).
Hovering your cursor over the map will:
- Highlight the map region for both maps.
- Highlight the corresponding region's mark in the jitter plot on both sides.
Hovering your cursor over a dot in the jitter plot does the following:
- Highlights the stacked dot plot mark for the region on both sides.
- Highlights the corresponding geographic region in the map for both sides.
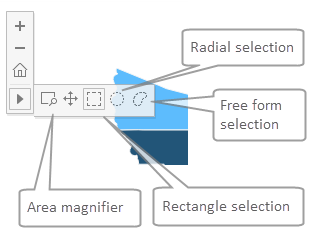
The area magnifier allows the user to click and drag over a map region to magnify the area.
The selection tools (Free form, Radial, and Rectangle) allow you to select a map area to filter the map. Using one of these tools has the following effects:
- The selected regions will be highlighted on both maps.
- The jitter plots on both sides will be narrowed down to the regions selected in the map.
Trends
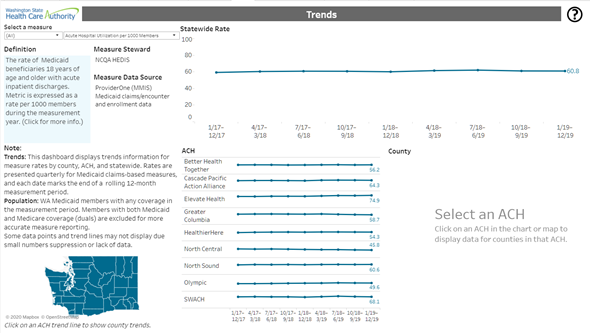
The Trends dashboard enables you to visually compare state, ACH, and county performance over time. Rates are presented quarterly for Medicaid claims-based measures, and each date marks the end of a rolling 12-month measurement period. Users can view up to eight rolling 12-month time periods in the dashboard. The map to the left highlights regions that have been selected in the dashboard.
What kind of questions can Trends answer?
- How has a county's rate for a measure changed over time?
- Is there a pattern of change for a specific measure?
How do I interact with Trends?
Select a measure using the dropdown at the top of the dashboard. The line graphs display rates for all time periods statewide and by ACH. Click on an ACH to display the counties within that ACH. Hover over a data point in the line graph to view the rate, denominator size, and confidence interval (the lower and upper limit range of values that the average of that data point is likely to be within).Transformation Measures
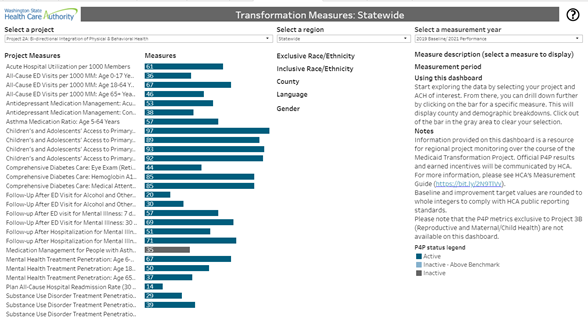
The Transformation Measures dashboard enables you to look at an ACH's performance for groups of pay-for-performance (P4P) measures associated with Medicaid Transformation Project areas. Rates are updated quarterly, and P4P improvement targets are included as a reference point. Clicking on a measure allows the user to see a break out of county and demographic rates.
What kind of questions can Transformation Measures answer?
- What is an ACH’s current performance in relation to their improvement target for a specific measure?
- What regional or demographic disparities may be driving overall performance on P4P measures?
How do I interact with Transformation Measures?
Select a project area and ACH region using the dropdowns at the top of the dashboard. The bar graphs display rates for the current measurement period, and the line indicates the ACH’s improvement target for that measure. Click on a measure to display the rates broken out by county, gender, race/ethnicity, and language. Hover over a data point to view the rate, denominator size, confidence interval (the lower and upper limit range of values that the average of that data point is likely to be within), and/or direction of improvement. Hover over an improvement target to display the baseline, benchmark, and improvement target values. Additional information about pay-for-performance measures can be found in the DSRIP Measurement Guide.Technical Documentation
The technical documentation covers information about the data sources, measures, and analytic approach to small numbers and confidence intervals.Data Sources
The measures included in the HW Dashboard are calculated using a number of data sources, including administrative data (ProviderOne Claims and Enrollment, ACES) and other records. Some measures draw solely from administrative or other sources, while others use multiple data sources to calculate measure rates. This section provides an overview of the data sources included in the dashboards and the resulting population, measures, and time periods of analysis for each source.
| Title | Description |
|---|---|
| ProviderOne Medicaid claims and enrollment data (a.k.a. Medicaid Management Information System or MMIS) | The MMIS data includes all health care claims and encounters for Medicaid beneficiaries, enrollment periods, and demographic and address information. In order to represent the most complete data set for the performance period, the state observes a six-month claims lag to account for data maturity and processing time. Example measures: Antidepressant Medication Management; Comprehensive Diabetes Care: Hemoglobin A1c Testing |
| Washington State Identification System (WASIS) arrest database | The Washington State Identification System (WASIS) arrest database is maintained by the Washington State Patrol. The database is comprised of arrest charges for offenses resulting in fingerprint identification. The database provides a relatively complete record of felony and gross misdemeanor charges, but excludes some arrest charges for misdemeanor offenses that are not required to be reported. Updated information from the WASIS arrest database is available quarterly with a six-month reporting lag. Example measure: Percent Arrested |
| Automated Client Eligibility System (ACES) data system | The DSHS Economic Services Administration’s Automated Client Eligibility System (ACES) is used by caseworkers to record information about client self‐reported living arrangements and shelter expenses. This information is used when determining eligibility for cash, food, and medical assistance. Updated information from the ACES data system is available quarterly. Example measure: Percent Homeless |
| OFM population estimates | Total county populations displayed in Medicaid Population Explorer are derived from Washington Office of Financial Management population estimates . The population estimates are developed as accurately as possible from standard and tested methods. The population figures represent the resident population of an area as defined by the federal Census Bureau. The figures include all persons usually residing in an area including military personnel and dependents, persons living in correctional institutions, and persons living in nursing homes or other care facilities. College students are considered residents of the place where they live while attending school. Seasonal populations, such as vacationers or migrant farm workers, are considered residents of the place they consider their usual residence. Persons with no usual residence are counted where they are on April 1. |
Dashboard dimensions and filters
The HW Dashboard includes a number of dimensions and filters. These filters, including age group, gender, race/ethnicity, and language, are derived from member information in the Medicaid enrollment files.
Population
The Medicaid population included in the HW Dashboard and measures is limited to the specific pay-for-performance eligibility criteria. There are three general eligible-population criteria applied to all of the Project P4P metrics:
- Inclusion of Medicaid and CHIP beneficiaries with comprehensive physical and behavioral health care benefits.
- Exclusion of beneficiaries that are eligible for both Medicare and Medicaid (duals).
- Exclusion of beneficiaries with primary insurance other than Medicaid (third-party liability).
Mixed and limited coverage (second and third bullets above) impacts the accuracy of measure reporting because there is either a non-comprehensive picture of health care encounters for the beneficiary, or the health care encounters being measured would not exist within the available data because the beneficiary isn’t covered for that service by Medicaid or CHIP.
Individual measures have additional eligibility criteria. Some metrics are population-based and report outcomes for all Medicaid beneficiaries that meet the basic eligibility criteria (e.g. arrests and homelessness). Other measures may apply any of the following criteria for eligibility:1
- Continuous coverage requirements, which would exclude individuals who experienced gaps in coverage
- Diagnosis-based requirements (e.g. Comprehensive Diabetes Care: HbA1C Testing)
- Episode or event-based requirements (e.g. Follow-up after Hospitalization for Mental Illness)
- Service exclusions (such as excluding those in hospice care)
- Restrictions for a demographic subset, such as age (e.g. Well-Child Visits: 3-6 Years)
The Population Explorer dashboard includes anyone with eligible Medicaid coverage in the given 12-month measurement year who isn’t excluded by the criteria above. Information about the population (demographic and geographic location) is a “snapshot” of this information from the Medicaid enrollment files using the latest information on record for each eligible member within the measurement year. Member age is determined as the age of the member as of the last day of the measurement year. For example, for measurement year 2017, age would reflect a member’s age as of December 31, 2017. This means that when filtering on age, you are seeing the population in that age category as of that date.
Measurement period and refresh
Measures are presented as rates over a specific time period (usually 12 months) for the population included in the specific measure. This is referred to as a measurement period, and measures with different data sources may report different measurement years. Each HW Dashboard refresh will include the latest available information for each data source.
Claims-based measures generally have a six- to nine-month lag from the end of the measurement year to reporting in the HW Dashboard. The 12-month measurement period for the current release is displayed in the Dashboard. The 12-month rolling measurement window will depend on the release month of the Dashboard, and will include a minimum six-month claims lag to account for processing time in the billing data in order to represent the most complete data set for the 12-month window. Likewise, all claims-based population and measure information will be “refreshed” and updated to the latest information with each release.
Age group
The HW Dashboard aggregates (or combines) individuals into a set of age groups in order to provide more focused reporting, and the user can filter by age group for most measures. As measures have different clinical-, policy-, and benefit-structure considerations, the age groups vary and are not standardized across measures. Age for the age group filter is calculated based on date of birth as of the last day of the measurement year.
Some measures also include predefined sub-metric age groups that are part of the official definition. For these measures, the age group filter will be designed in accordance with the submetrics, so as to avoid conflicts.
Gender
Gender is based on self-reporting at the time of enrollment. Field values include: male and female. Although currently limited to sex-assigned-at-birth options, beneficiaries can choose a gender, and work is underway to incorporate gender identity into applications and other processes.
Race/ethnicity
Race and ethnicity are also derived from ProviderOne enrollment files and based on self-reporting by the individual. In order to describe populations in ways that are most reflective of how individuals identify, the HW Dashboard includes two different approaches to racial and ethnic categorization. These approaches can be summarized as inclusive and exclusive categories.
Inclusive race/ethnicity
Individuals are counted towards each race/ethnicity category they select, which promotes a more informed understanding of community needs, health disparities, and opportunities. Because individuals can be in multiple categories, the category counts will not add up to 100 percent. With this approach there are the following groups:
- American Indian/Alaskan Native
- Asian
- Black
- Hispanic/Latino
- Native Hawaiian/Pacific Islander
- White
- Other
- Unknown
Exclusive race/ethnicity
Individuals are counted in a single race category, using the race selection entered in the first race field in ProviderOne. This approach allows for an easy snapshot of individuals who identify as any minority group, and that category counts will always add up to 100 percent. However, this does not capture how individuals may identify with multiple race/ethnicity groups. With this approach there are three groups:
- Non-Hispanic white: Individual only selects a single race “white” and does not select Hispanic ethnicity.
- Any minority: Individual selects Hispanic ethnicity, and/or reports a race category other than “white” in any of the race fields.
- Unknown: Individual does not identify any ethnicity or at least one racial category.
Language
Language is derived from self-reported preferred spoken language. The HW Dashboard language filter includes five language categories: the top four most common languages are displayed, and all other languages are grouped into the “other” category.
Geographic association
Geographic area member counts and measure rates (e.g. zip code, county, ACH) are derived from residential addresses provided by the Medicaid enrollment files. Geographic information displayed in the Medicaid Population Explorer uses the latest physical address available in the measurement window to map a given member's address to a county and ACH. Geocoded most recent addresses are further used to associate a member with a single zip code, school district and state legislative district. School district associations are independent of school enrollment. Due to limitations in geocoding methods, estimated member counts in these geographies may be smaller than actual member counts.
Note: Beneficiaries enrolled in the Washington State Address Confidentiality Program (ACP) who use the ACP address as their physical address (as permitted by law) will be included in the Thurston County counts at the zip code, county, and ACH levels. This is due to protections afforded to confirmed ACP participants who are also Medicaid beneficiaries, which protections limit ACP participants’ actual physical address information from being captured in the data. These beneficiaries can opt to use the generic ACP address with an associated zip code of 98507, in lieu of providing an actual physical address. See https://hca.wa.gov/health-care-services-supports/program-administration/address-confidentiality-program-acp for more details about this program.
Measure attribution
For statewide, ACH, and county regional attribution for measures, individuals must have a minimum period of residence in the state and in the ACH region in order to be counted in the measure rate for that region. For most measures, a member needs to have lived in a region for 11 out of the 12 months in the measurement period to count in the measure rate. For some measures, this requirement was too rigid and resulted in a large (> 15%) percentage of members dropping out as unattributed. For these measures the attribution requirement was lowered to 7 out of 12 months. The unattributed populations are included in category 2 data products for the ACHs, but are not visualized on the HW Dashboard. Some other measures have no regional attribution requirement and members are assigned to geographic regions based on their most recent Washington address. The following tables list measures with no attribution requirement or a 7 of 12 months attribution requirement; all other measures have an 11 of 12 months attribution requirement:
| Measure | Attribution (months) |
|---|---|
| Acute Hospital Utilization per 1000 Members | 11 out of 12 |
| All-Cause Emergency Department (ED) Visits per 1000 Member Months | 7 out of 12 |
| Antidepressant Medication Management | 11 out of 12 |
| Asthma Medication Ratio | 11 out of 12 |
| Children's and Adolescent's Access to Primary Care Practitioners | 11 out of 12 |
| Comprehensive Diabetes Care: Eye Exam (Retinal) Performed | 11 out of 12 |
| Comprehensive Diabetes Care: Hemoglobin A1c Testing | 11 out of 12 |
| Comprehensive Diabetes Care: Medical Attention for Nephropathy | 11 out of 12 |
| Follow-up After Emergency Department (ED) Visit for Alcohol and Other Drug Abuse or Dependence | 11 out of 12 |
| Follow-up After Emergency Department (ED) Visit for Mental Illness | 11 out of 12 |
| Follow-up After Hospitalization for Mental Illness | 11 out of 12 |
| Medication Management for People with Asthma: Medication Compliance 75% | 11 out of 12 |
| Mental Health Treatment Penetration (Broad Version) | 11 out of 12 |
| Patients Prescribed Chronic Concurrent Opioids and Sedatives Prescriptions | 11 out of 12 |
| Patients Prescribed High-Dose Chronic Opioid Therapy | 11 out of 12 |
| Percent Arrested | 7 out of 12 |
| Percent Homeless (Narrow Definition) | 7 out of 12 |
| Periodontal Evaluation in Adults with Chronic Periodontitis | 7 out of 12 |
| Plan All-Cause Hospital Readmission Rate (30 Days) | 11 out of 12 |
| Primary Caries Prevention Intervention as Offered by Medical Provider | 7 out of 12 |
| Statin Therapy for Patients with Cardiovascular Disease (Prescribed) | 11 out of 12 |
| Substance Use Disorder Treatment Penetration | 11 out of 12 |
| Substance Use Disorder Treatment Penetration (Opioid) | 11 out of 12 |
| Well-Child Visits in the 3rd, 4th, 5th, and 6th Years of Life | 11 out of 12 |
Statewide attribution
An individual may have multiple addresses in the state while still meeting the attribution requirement. Members will be considered unattributed at the state level if they failed to meet attribution requirements while their most recent address was still within the state of Washington.
Accountable Community of Health (ACH) attribution
To be attributed to an ACH, the residential address (or addresses) on file in the Medicaid enrollment files must consistently be within the ACH’s geographic boundaries for the relevant measurement period. This methodology attributes a Medicaid beneficiary experience to a single ACH for a given measurement period. In effect, this limits the population for performance measurement purposes to a relatively stable group of beneficiaries. This approach ensures the ACH is accountable for a population that was likely living in the region for the majority of the measurement period, based on the best available data, and likely to experience impacts from Medicaid Transformation Project activities. The objective is to establish an accountability structure that is fair and sets a reasonable performance expectation.
For most metrics, the residential address on file in the Medicaid enrollment files is required to be within the ACH geographic boundaries for 11 out of 12 months of the measurement period. However, a subset of metrics will use the less restrictive 7 out of 12 months. A member may have multiple addresses in a single ACH region within a measurement period and still meet the attribution requirement. Members will be considered unattributed for an ACH if they failed to meet attribution requirements, but their most recent address was still within the geographic boundaries of the ACH.2
Measure domains
The HW Dashboard contains more than 100 measures and sub-metrics, which are grouped into six domains: access, coordination, quality, social, surveillance, and utilization. Users can select a measure domain in the HW Dashboard to view all of the measures associated with that domain. HW Dashboard measure domains are intended to align with HEDIS® and DSHS categories.
| Domain | Measures |
|---|---|
| Access | Children's and Adolescents' Access to Primary Care Practitioners Mental Health Treatment Penetration (Broad Version) Primary Caries Prevention Intervention as Offered by Medical Provider Substance Use Disorder Treatment Penetration Substance Use Disorder Treatment Penetration (Opioid) Well-child Visits in the 3rd, 4th, 5th, and 6th Years of Life |
| Coordination | Follow-up After ED Visit for Alcohol and Other Drug Abuse or Dependence Follow-Up after ED visit for Mental Illness: 7 Days Follow-up After ED Visit for Mental Illness: 30 Days Follow-up After Hospitalization for Mental Illness: 7 Days Follow-up After Hospitalization for Mental Illness: 30 Days Statin Therapy for Patients with Cardiovascular Disease (Prescribed) |
| Quality | Antidepressant Medication Management Asthma Medication Ratio Comprehensive Diabetes Care: Eye Exam (Retinal) Performed Comprehensive Diabetes Care: Hemoglobin A1c Testing Comprehensive Diabetes Care: Medical Attention for Nephropathy Medication Management for People with Asthma: Medication Compliance (75%) Periodontal Evaluation in Adults with Chronic Periodontitis Plan All-Cause Hospital Readmissions Rate (30 Days) |
| Social | Percent Arrested Percent Homeless (Narrow Definition) |
| Surveillance |
Patients Prescribed Chronic Concurrent Opioids and Sedatives Prescriptions |
| Utilization | Acute Hospital Utilization, per 1000 Members All-Cause ED Visits, per 1000 MM Patients Prescribed High-Dose Chronic Opioid Therapy Utilization of Dental Services |
Confidence Intervals
Confidence Intervals (CI) provide a range of uncertainty around an estimated number. They include the lower and upper limit numbers for that range where the average of that data point is likely to fall within, generally with 95% accuracy. They are often used with survey data to indicate how the sample drawn for the survey might differ from the underlying population. In the HW Dashboard, however, most measures use the entire population either of Medicaid claimants (excluding those claimants who were also eligible for Medicare) or of Washington State, and so there is no sampling error. In this case, the CI is used to account for uncertainty that arises from random variation that could be largely due to the relatively small sizes of some population subgroups or geographical areas.
Privacy and Protection - Small Numbers
Suppression methods follow the Washington State Health Care Authority small numbers standards to address confidentiality and reliability issues with small numbers.
The publicly-available version of the HW Dashboard suppresses data using the following primary suppression criteria:
- Rates are suppressed when the numerator is a nonzero value less than 11
- Rates are suppressed when the measure denominator is less than 11
- Data are suppressed when the cell size is less than 11 individuals
In order to prevent computation of values removed in primary suppression, additional data are suppressed (a step known as secondary suppression). This prevents users from being able to “back into” small numbers. Groups with consistently small numbers may be excluded from Medicaid Population Explorer to improve user experience and prevent undesirable secondary suppression.
Example: How suppression works in the Medicaid Population Explorer dashboard
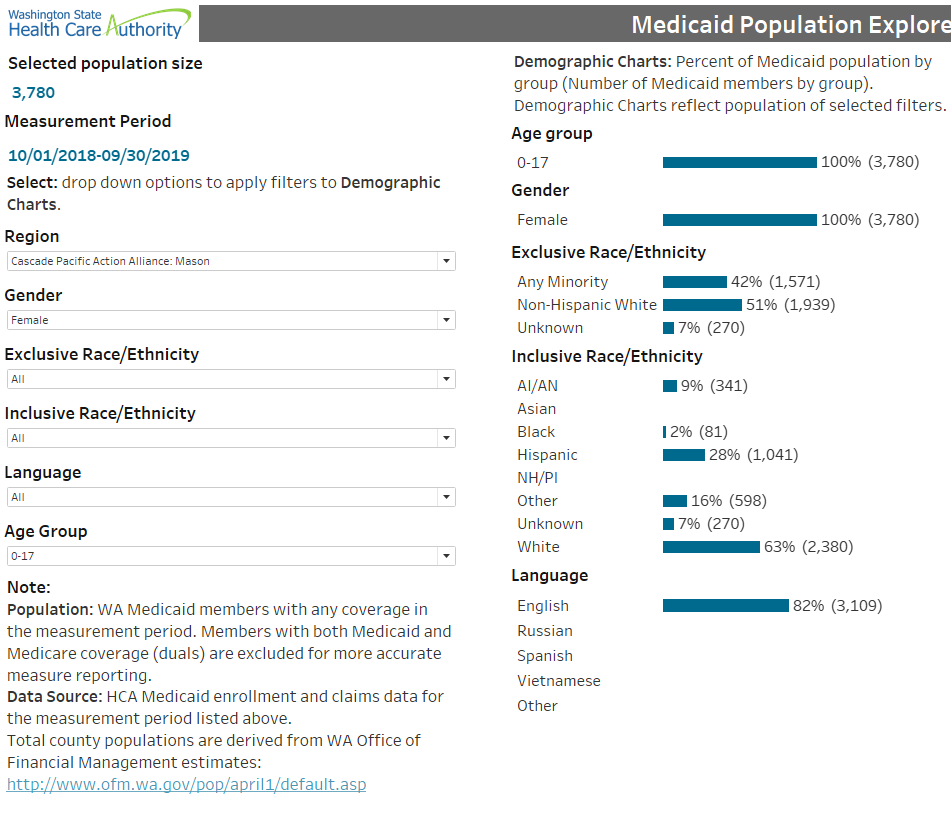
In the Population Explorer dashboard screen shot example above, we are filtered on:
- Region: Cascade Pacific Action Alliance: Mason
- Age Group: 0–17
- Gender: Female
The applied filters show that there are 3,780 female children in Mason County with Medicaid coverage. The demographic charts show a further breakdown of this population. The inclusive race/ethnicity categories will not sum to 3,780, since an individual can be counted multiple times if they select multiple race/ethnicity categories. Asian and Native Hawaiian/Pacific Islander categories are suppressed in this chart. For language, there are 3,109 English-speakers and all other categories are not displayed so that the 671 suppressed counts are suppressed in a way that does not allow a user to derive the missing numbers. Although you can assume that the numbers that are primary suppressed are very small or are zero, the numbers that are secondary suppressed are removed to further reduce the ability to derive the small numbers.
Measures
This section provides high-level information about measure calculation for measures included in the HW Dashboard. Detailed information about claims-based and P4P measures can be found by clicking the links below. Information for non-claims-based and non-P4P measures is provided below.
Pay-for-performance (P4P) measures
Specification sheets for P4P measures are available on HCA’s website. Please note that the P4P metrics exclusive to Project 3B (Reproductive and Maternal/Child Health) are not available on this dashboard.
Half of the metrics associated with Project 3B: Reproductive and Maternal/Child Health require additional information from either the First Steps databases or Vital Statistics, a Washington State Department of Health data source. Due to different data update schedules and production timelines, these metrics are calculated approximately 3-4 months later than other P4P metrics. The First Steps Database (FSDB) was designed to evaluate and monitor programs and services for low-income and other high-risk women and children in Washington State. Created and maintained by the Washington State Department of Social and Health Services-Research and Data Analysis (DSHS-RDA), the FSDB links vital statistics (such as birth and death certificate information provided by the Department of Health Center for Health Statistics); Medicaid claims, encounter, and eligibility data; immunization registry; and other information sources (see the DSRIP Measurement Guide for more information).
Given the sensitive nature of this information, FSDB operates under a separate and more restrictive confidentiality agreement under the Washington State Institutional Review Board and cannot share results that contain small numbers with outside entities. Thus, the demographic and geographic breakouts that are available are very limited and metric results will only be calculated for calendar year (Jan – Dec) and state fiscal year (July – June). In addition, the multiple data sources that contribute to the FSDB are updated at different frequencies and metric results may not be available on the same timeline as other metrics for inclusion in the HW Dashboard. However, publicly-available Maternal and Child Health Measures Reports are located on HCA’s box.com site, and a separate Maternal and Child Health Dashboard will become publicly-available during Summer 2020.
Notes
1The DSRIP Measurement Guide provides more about eligibility criteria. Back to Dashboard dimensions and filters
2See DSRIP Measurement Guide for more information. Back to ACH attribution